Statistics with 360 degree insight into your business
BitaBIZ analyzes your absence, working hours and HR ratios in depth.
An accurate insight into the company’s key figures often requires a lot of resources, but you do not have to downgrade the task.
BitaBIZ has a built-in statistics module. It gives you accurate reports with calculation of all official key figures within absence, working hours and HR.
It gives you a basis for the work of optimizing your business.
Report library
BitaBIZ gives you a complete collection of
key figures within working hours, absence and HR.
For this you will get:
✓ Report library
✓ Sickness absence – Bradford factor
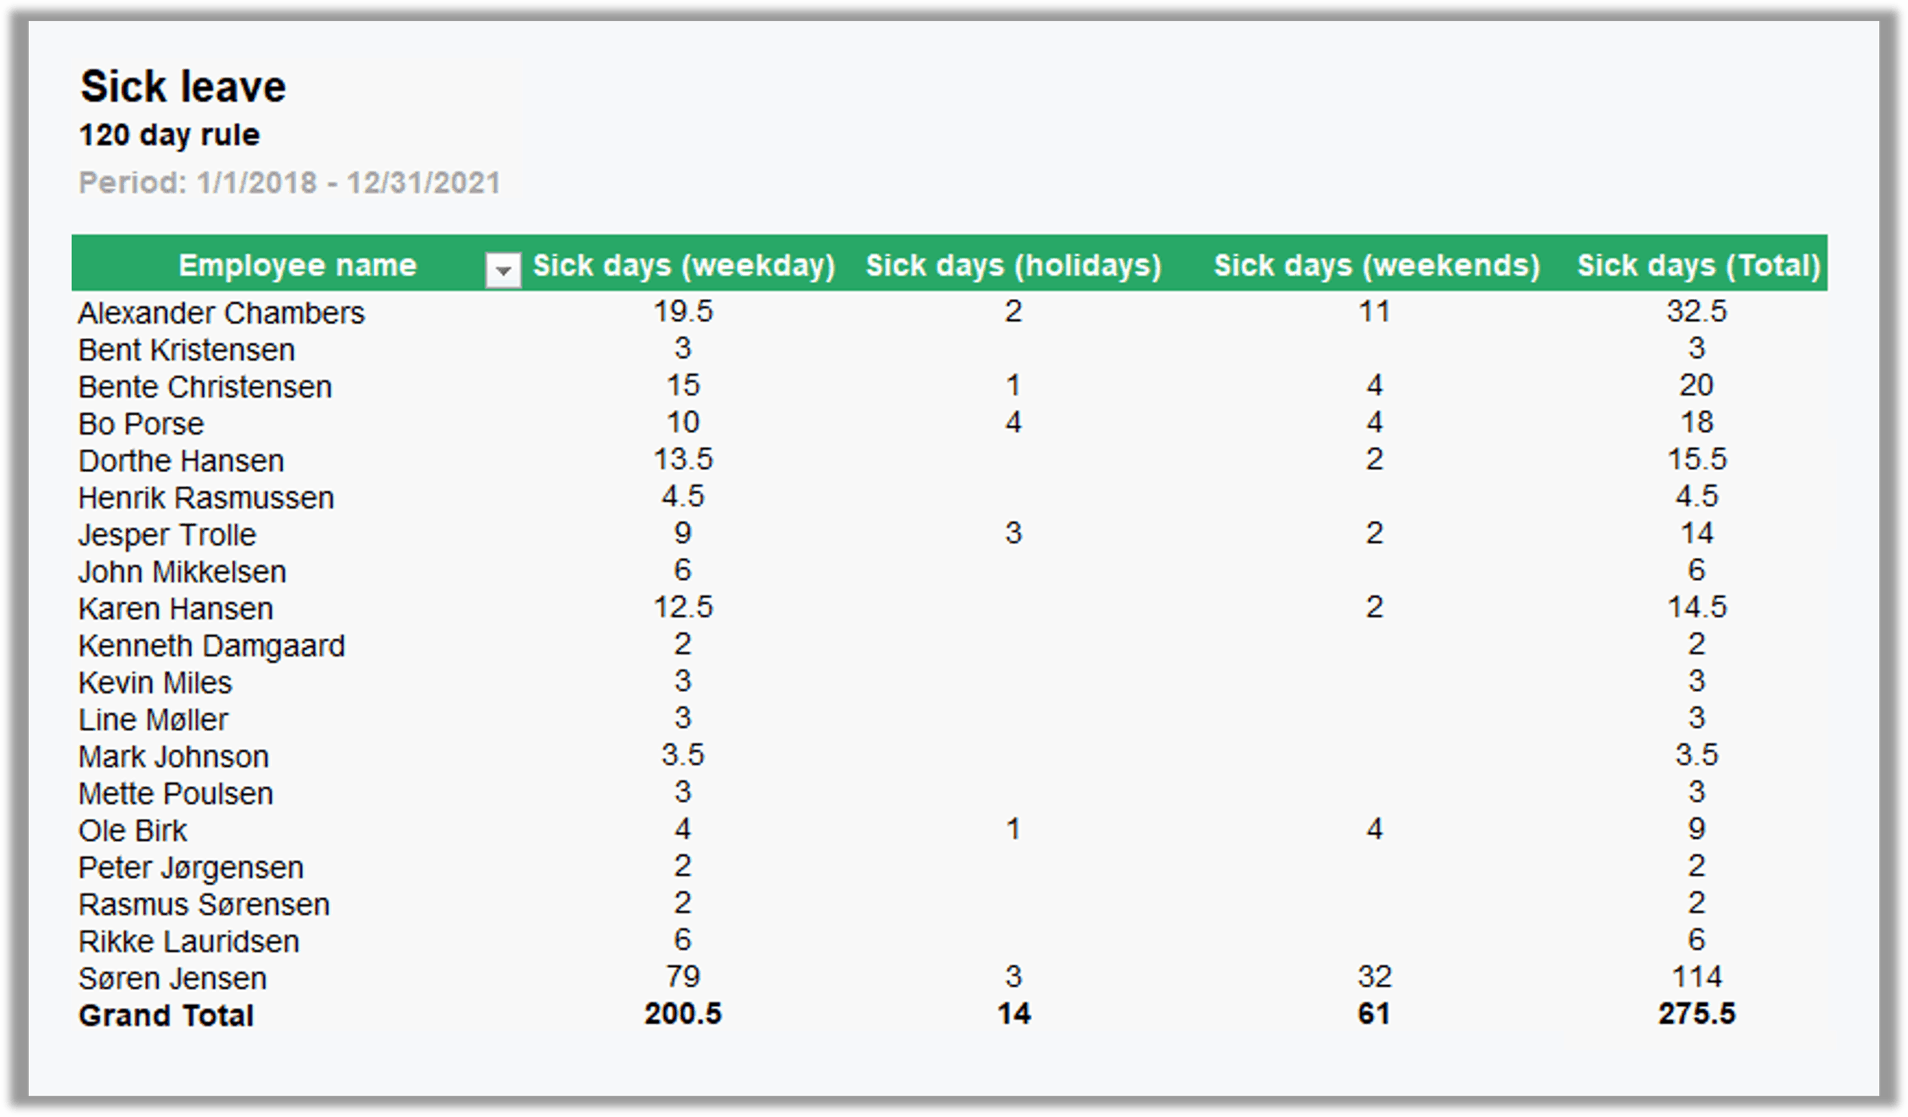
✓ Sick leave – 120 day rule
✓ Absence – residual holiday and holiday-free
✓ Working hours – the 48 hour rule
✓ Working hours – capacity utilization
✓ Working hours – paid hours per employee, department, etc.
✓ HR – staff turnover, arrival and departure
✓ Timebank – the development of overtime
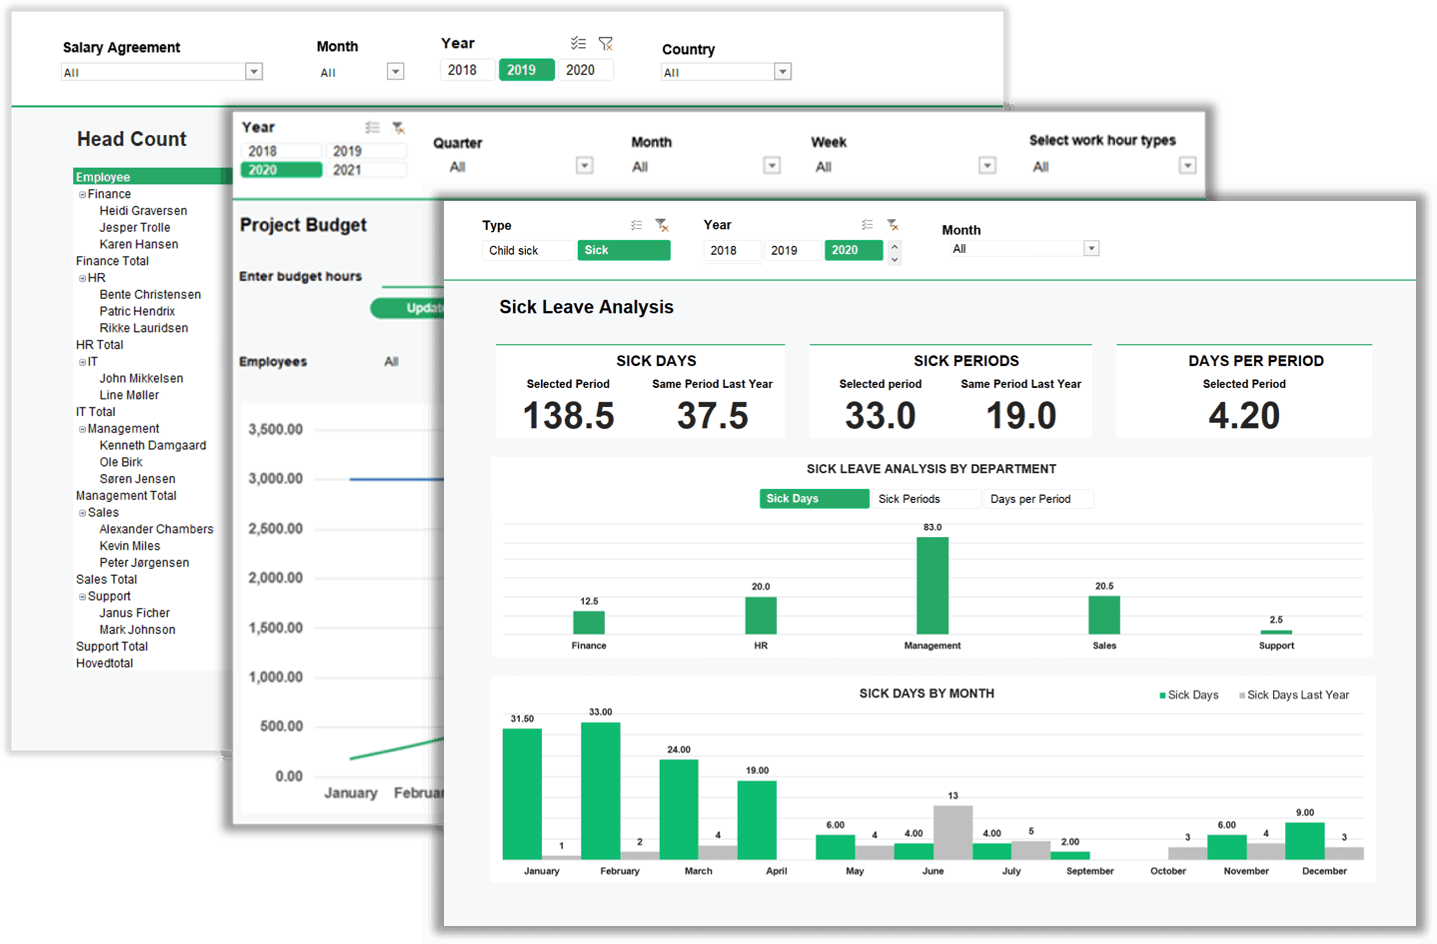
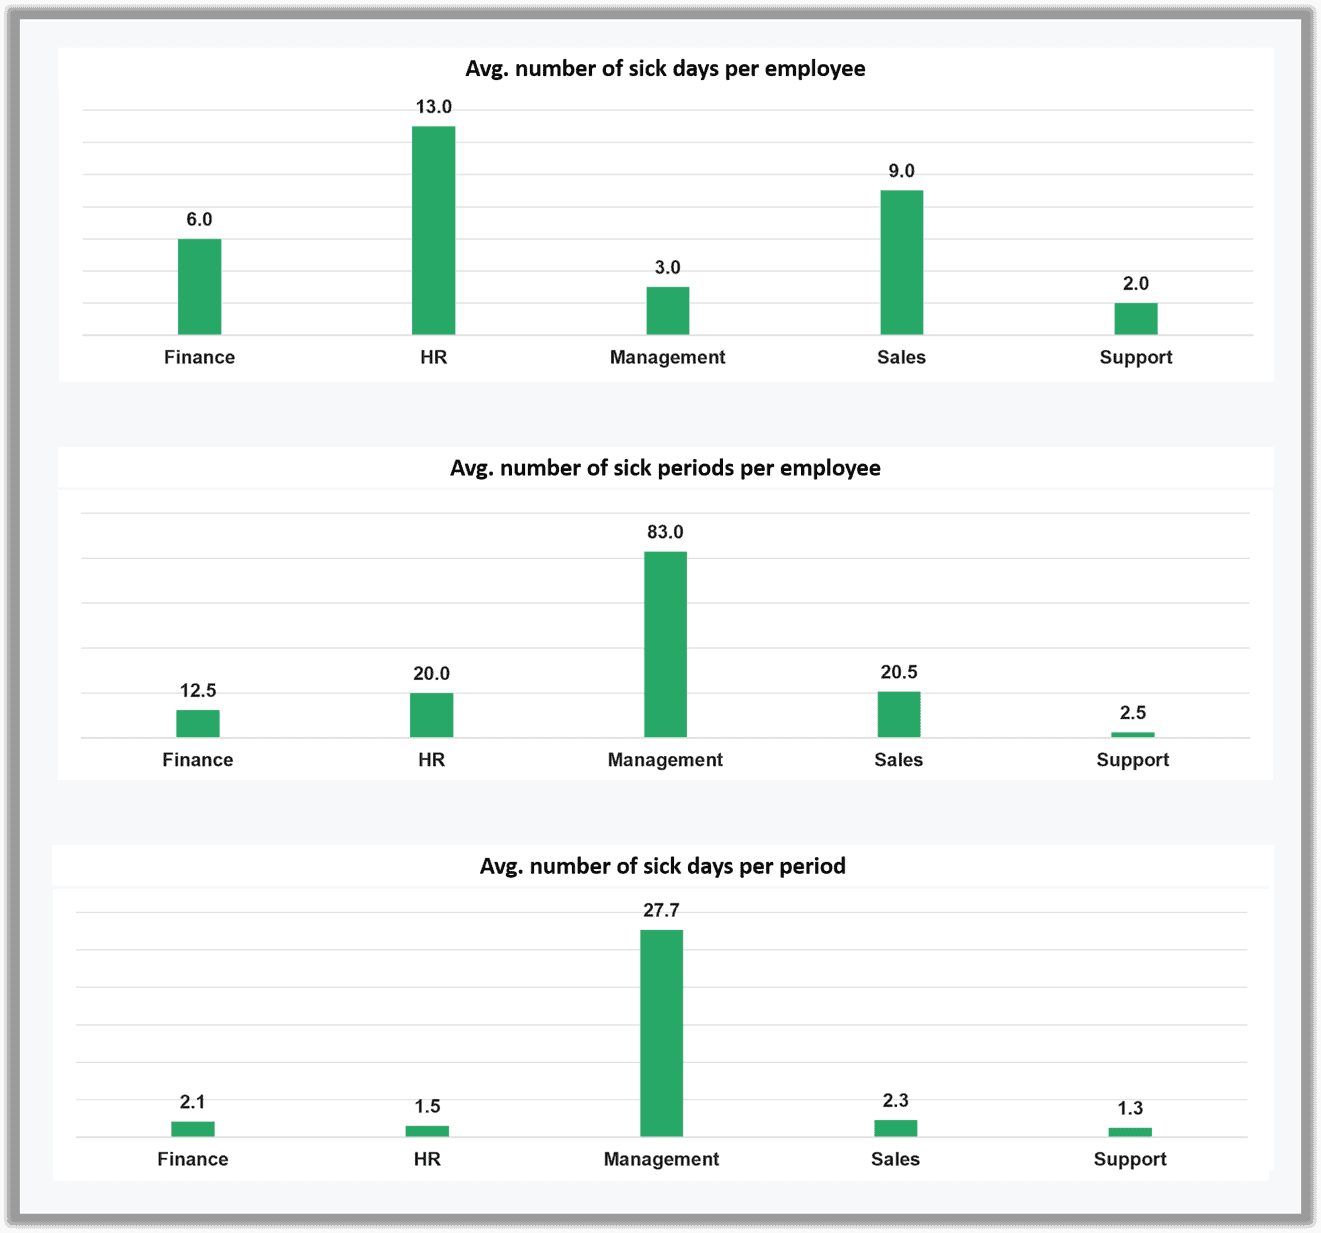
Departments
Insight into each department on three key parameters:
- Avg. number of sick days per employee.
- Avg. number of sick periods per employee.
- Avg. number of sick days per period.
The statistics identify if a department has very short-term sick leave – A very short-term sick leave can be an identification of declining productivity.
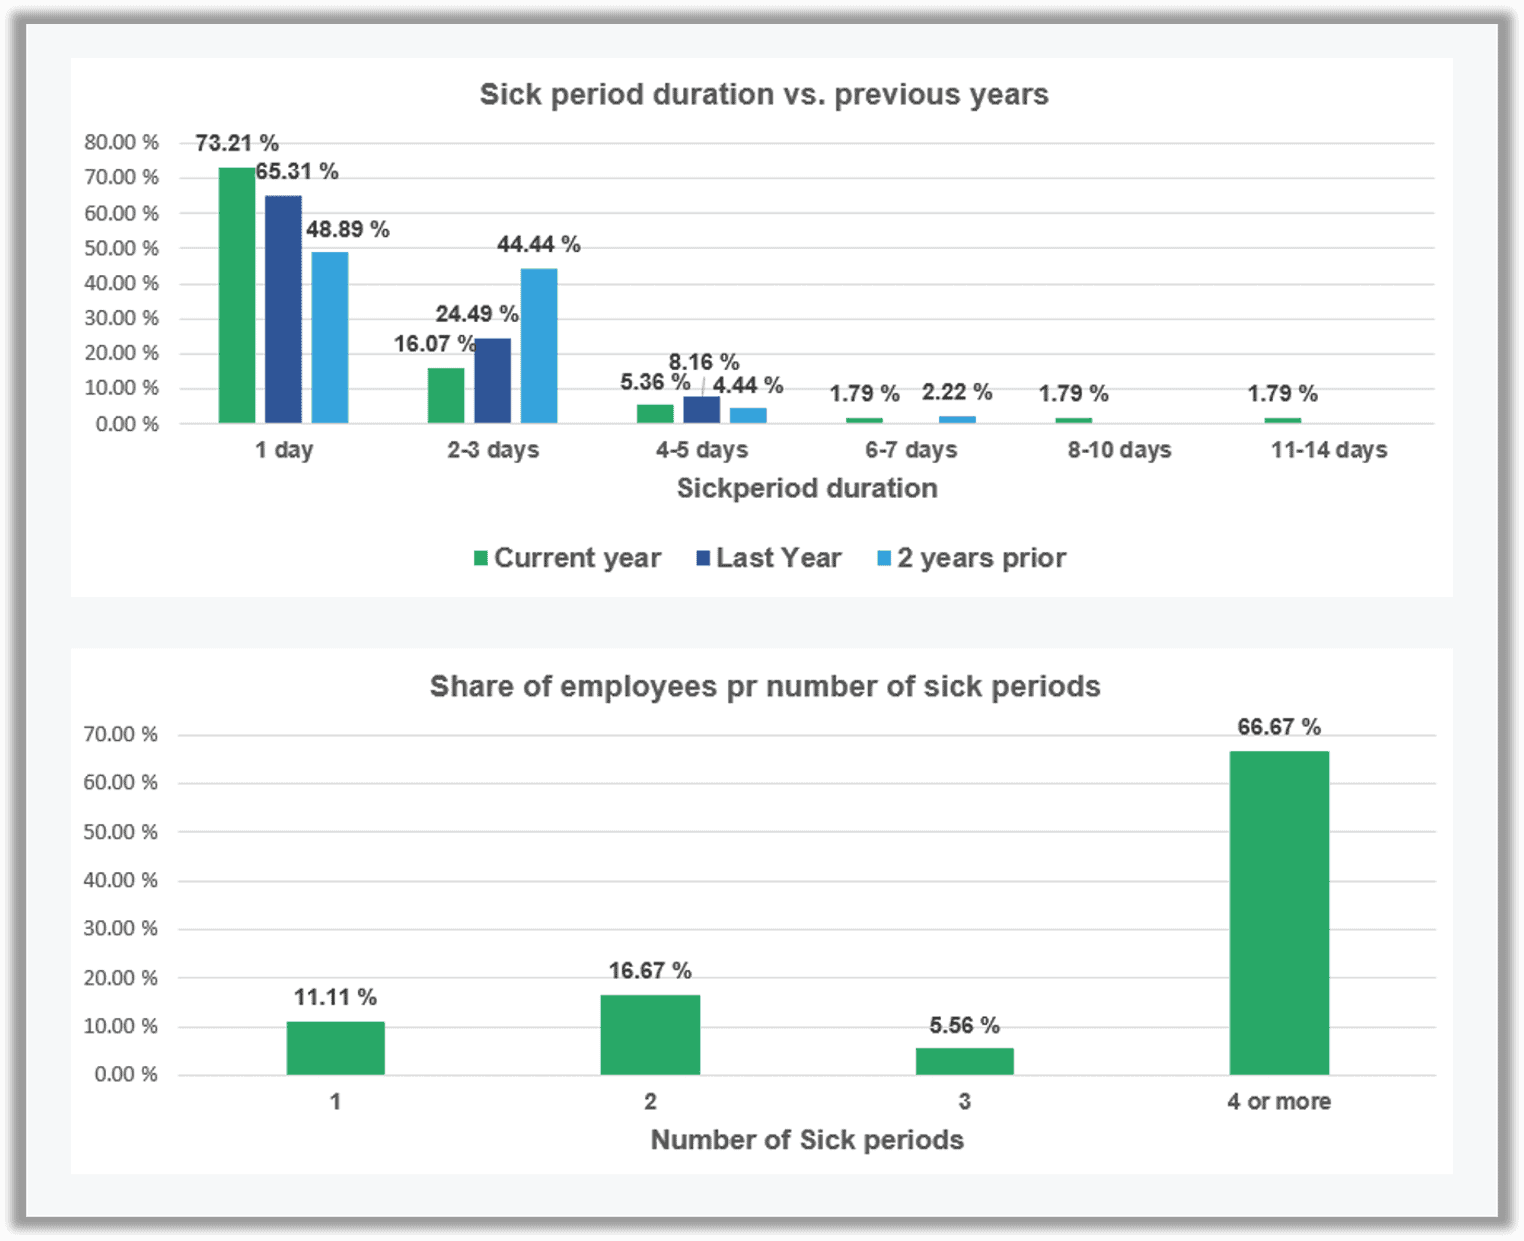
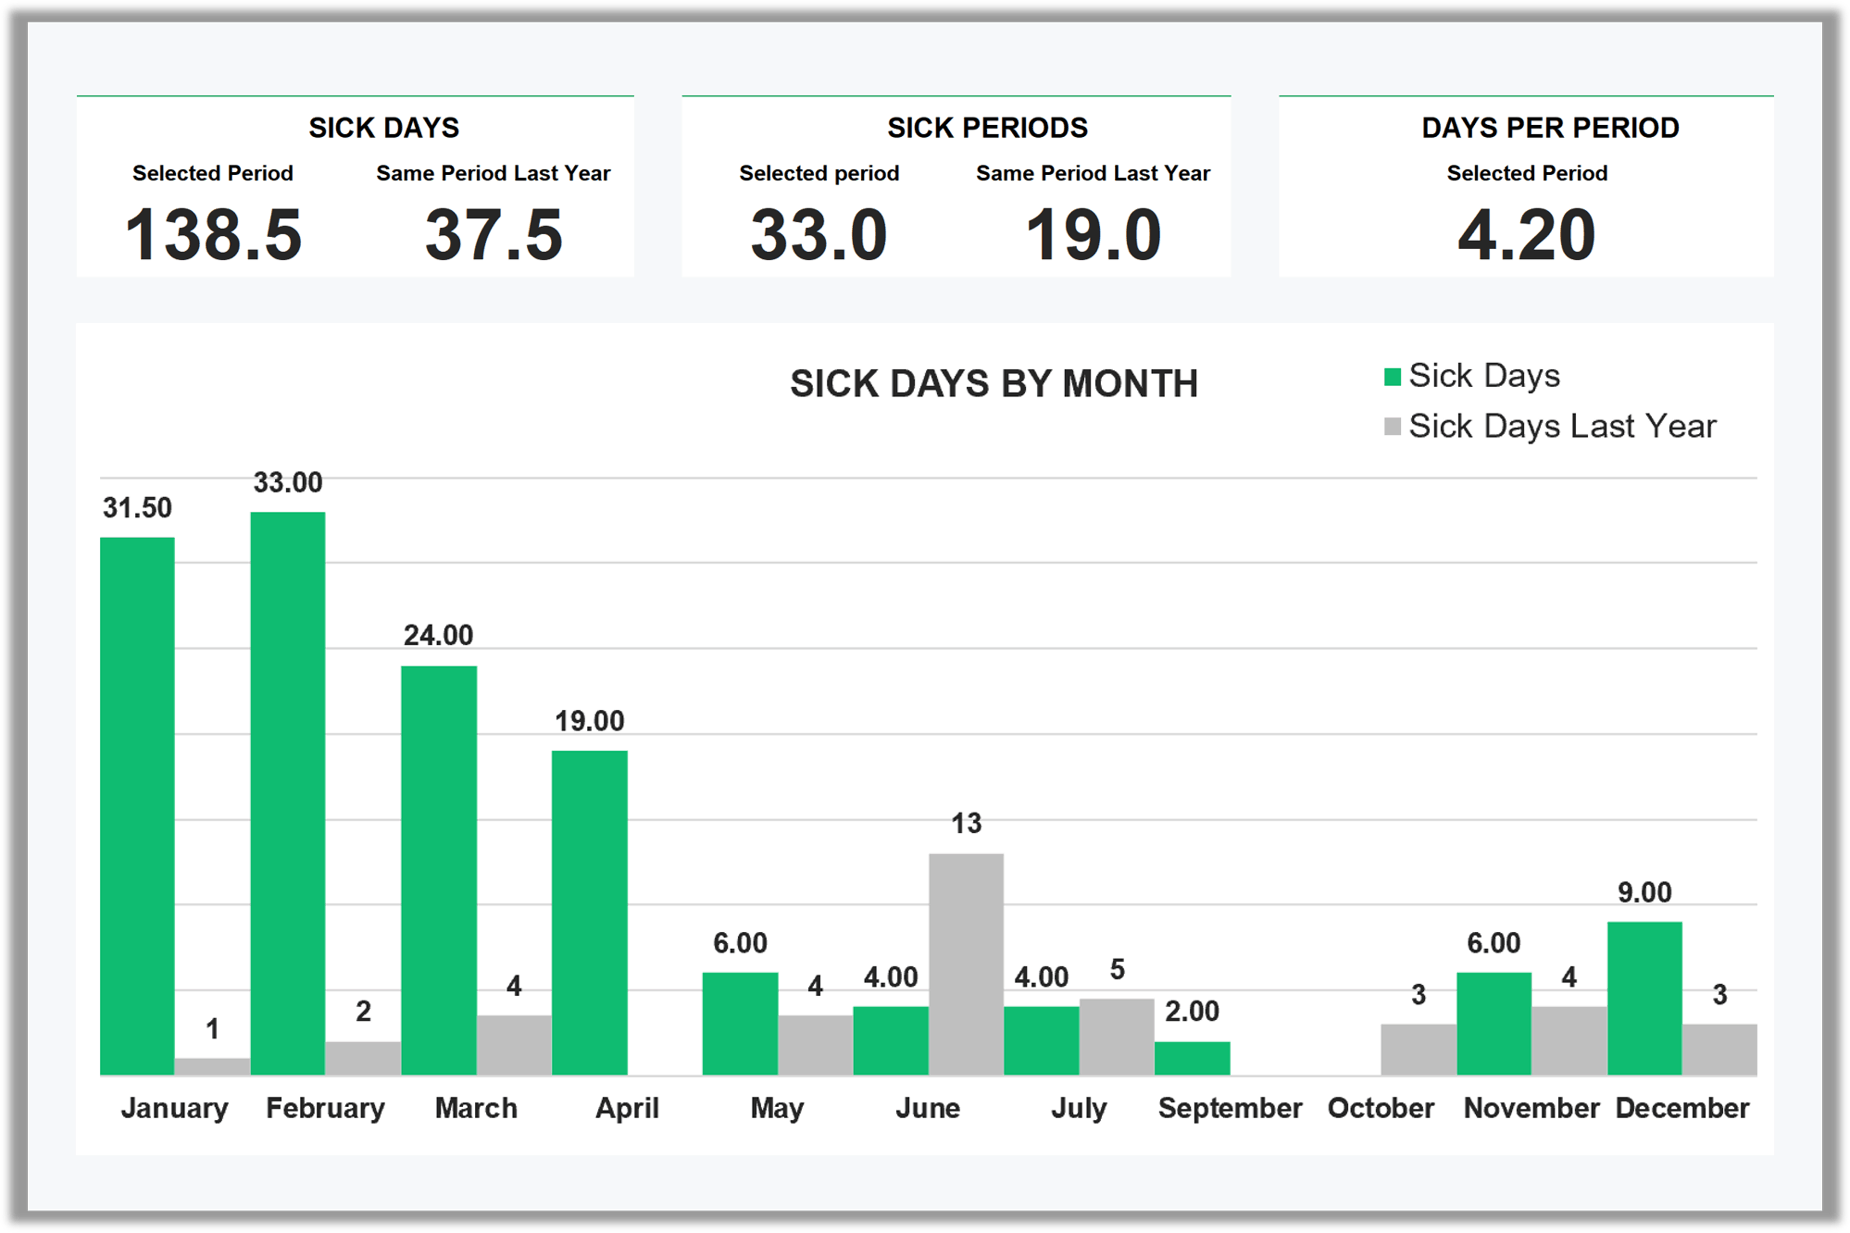
Key figures:
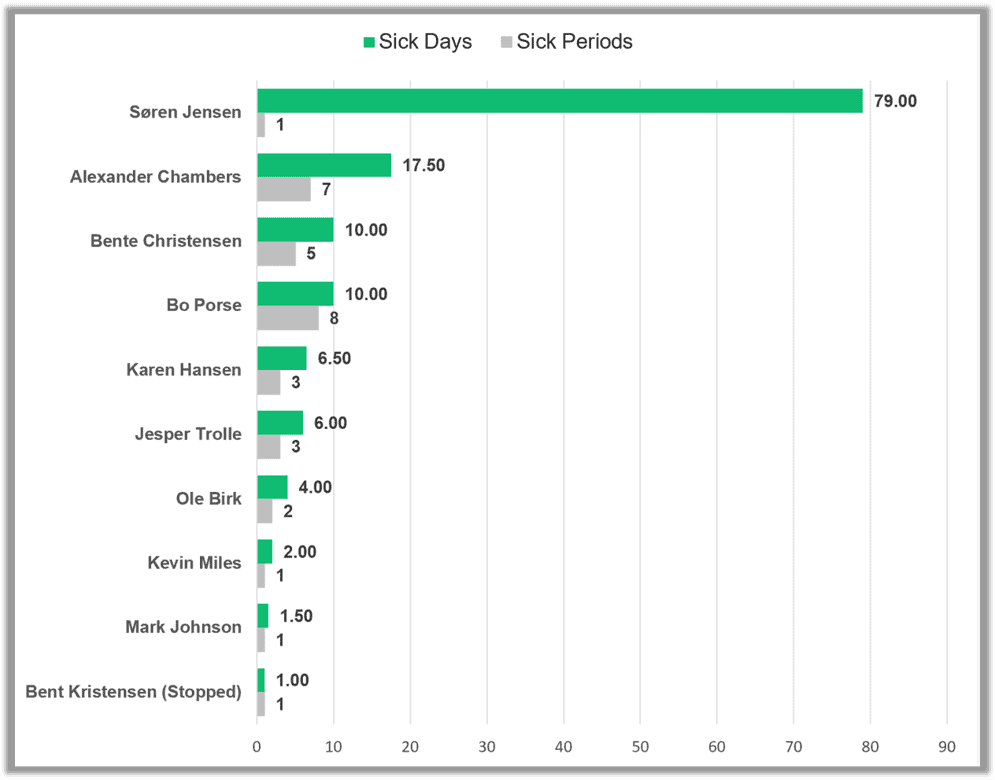
Employee
Insight into the individual employee’s sick leave on two important parameters:
- Number of sick days per employee
- Number of sick periods per employee.
In addition, the report identifies the average number of days per sick period.
The statistics identify employees with a high number of sick days and/or a high number of sick periods.
Key figure:
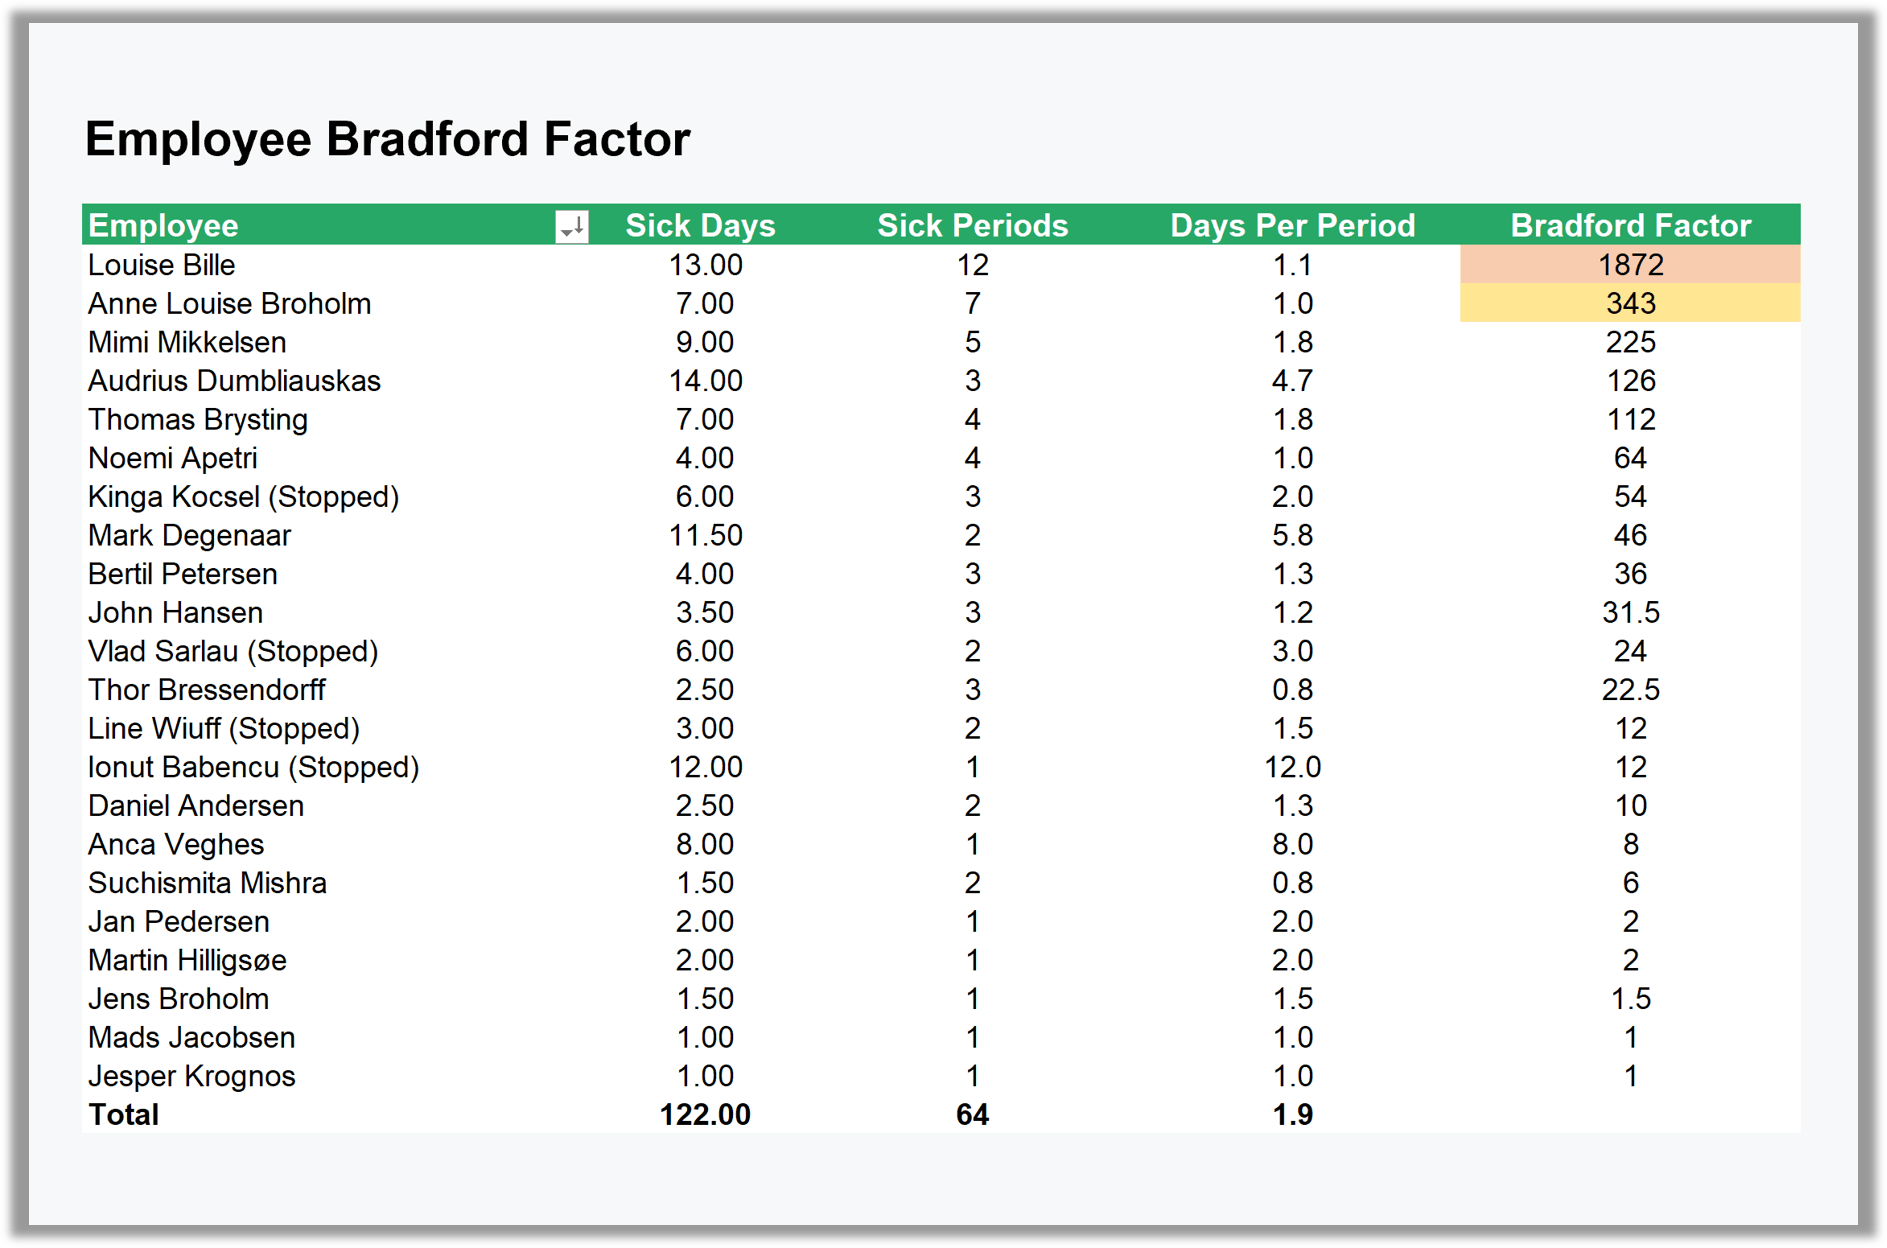
Bradford factor
Many frequent sick periods may stress the daily operations more than long-term sick leave.
The Bradford Factor is a key figure that focuses on short-term sick leave.
If an employee during a 12-month period has a Bradford factor of +400 then you might consider having a clarifying discussion.
Key figure: